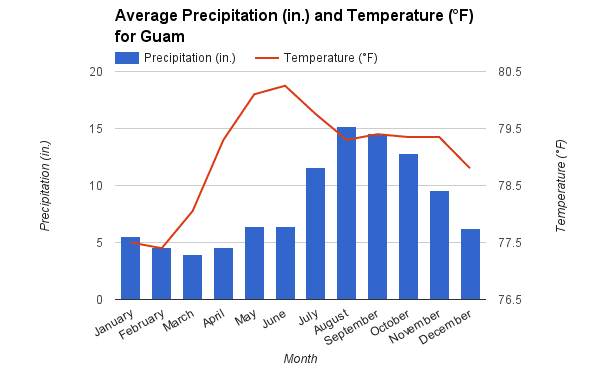
The climatogram of my region is a chart, based on one year of data, showing both the average precipitation and temperature information for Guam, a U.S. island territory in Micronesia, in the Western Pacific Ocean. A seasonal pattern or general trend of my climatogram is the average precipitation is higher in the summer and autumn months of July, August, September, October, and November. The average precipitation is lower in the late winter and early spring months of February, March, and April. Also, when the average temperature is lower in February, at 77.4 °F, and higher in June, at 80.25 °F. The Pacific Ocean receives an average of roughly 50 inches of rain per year, so the amount of precipitation near Guam is slightly higher than average. The climate effects the living organisms that live here because the warmer air and ocean temperatures caused by the climate impact many of the living organisms, and they alter their communities by triggering events which could potentially further alter the chemistry of the ocean, and these alterations impact many of the living organisms that depend on the Pacific Ocean biome as their home.